
I’m a runner and outdoor enthusiast who love data science and have an interest in technology, healthcare and consulting.
I graduate from UC Davis with a B.S. degree in Statistics and currently working towards M.S. in Analytics - Data Science at Georgetown University
I have sufficient experience in conducting data analysis using tools like R, Python, SQL and SAS, with specialties in data visualization, machine learning and data mining.
Below are some visualizations created by Python and R packages, Tableau, etc.
You can find out more at showcase page.


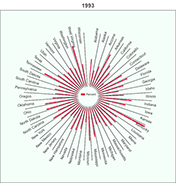
D3 Network
US college competition
DMV Food Desert
Multilayer Temporal - ggplot2
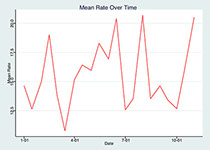
Lag plot & Running sequence
ggplot2-2
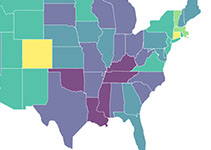
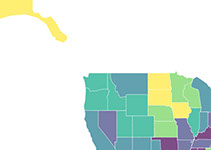
US Obese Rate 2009
US Mental Unhealthy Rate 2009


City Population 2014
US Cancer and Population
Population and Poverty
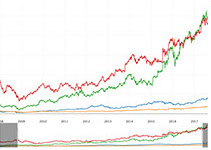
Stock Price Trends
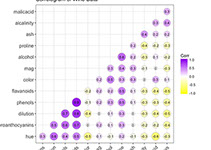
Correlation Plot - ggplot2
TOP

US Cancer and Population

TOP

TOP